South Florida’s shortsale market is currently at equilibrium with about 6.5 months of supply currently listed for sale in the tricounty region of Miami-Dade, Broward and Palm Beach, according to an analysis by CondoVulturesRealty.com.
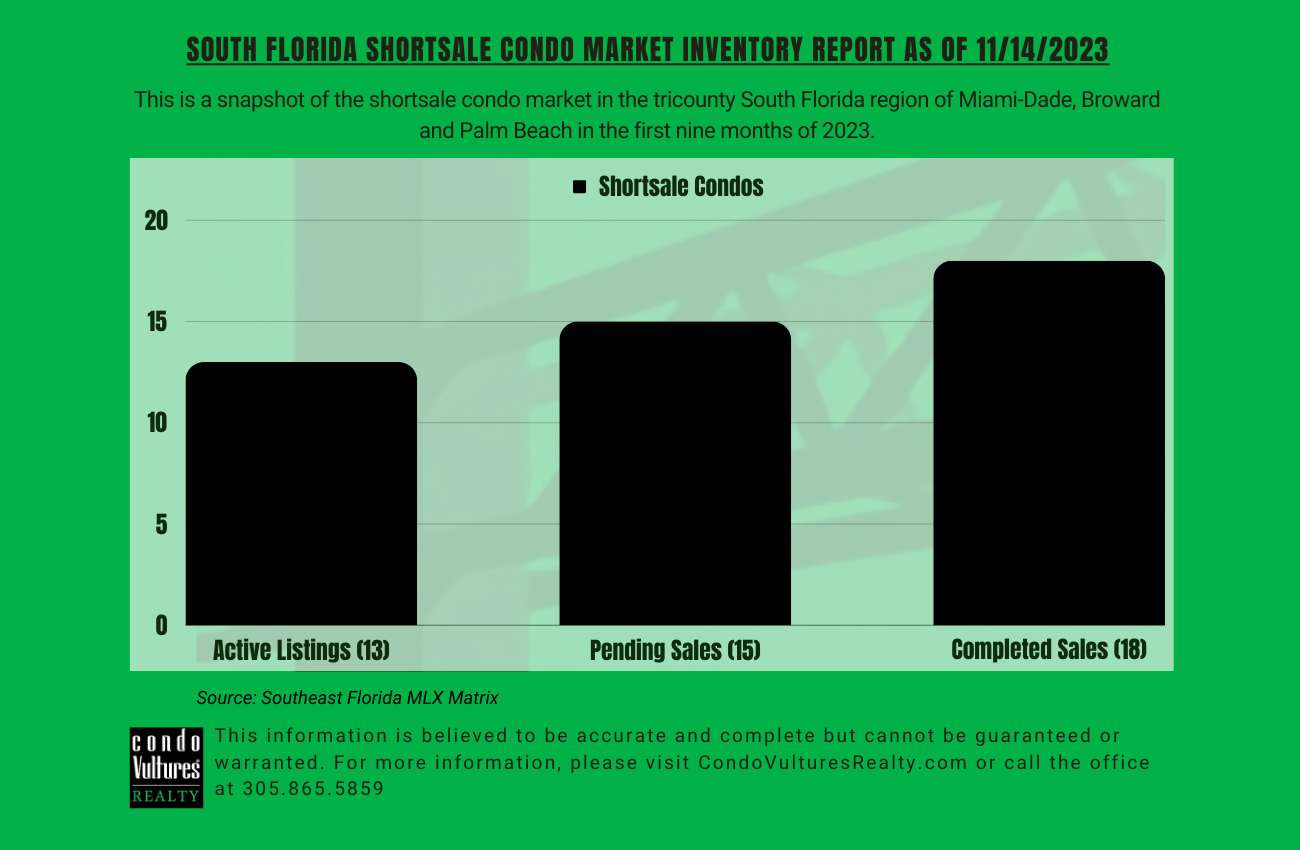
In the first nine months of 2023, buyers purchased an average of two units per month for a total of nearly 18 units between January and September.
Based on the currently actively listings in the Multiple Listing Service – a database used by Realtors to market condos – neither the buyers or sellers have an advantage over buyers based on the supply available for purchase.
Generally, six months of supply is considered equilibrium for the South Florida housing market. Less months indicates a sellers market and more months points to a buyers market from a negotiating perspective.
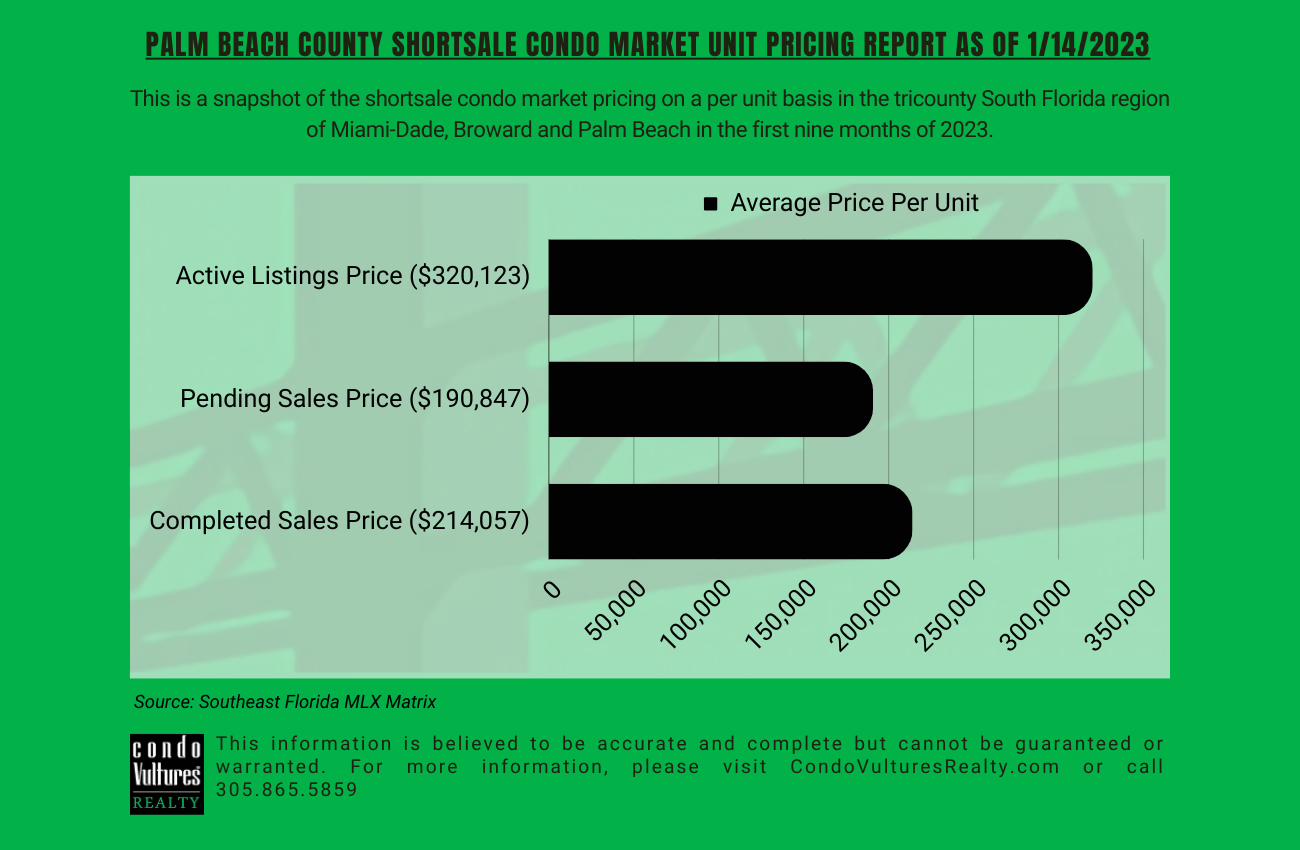
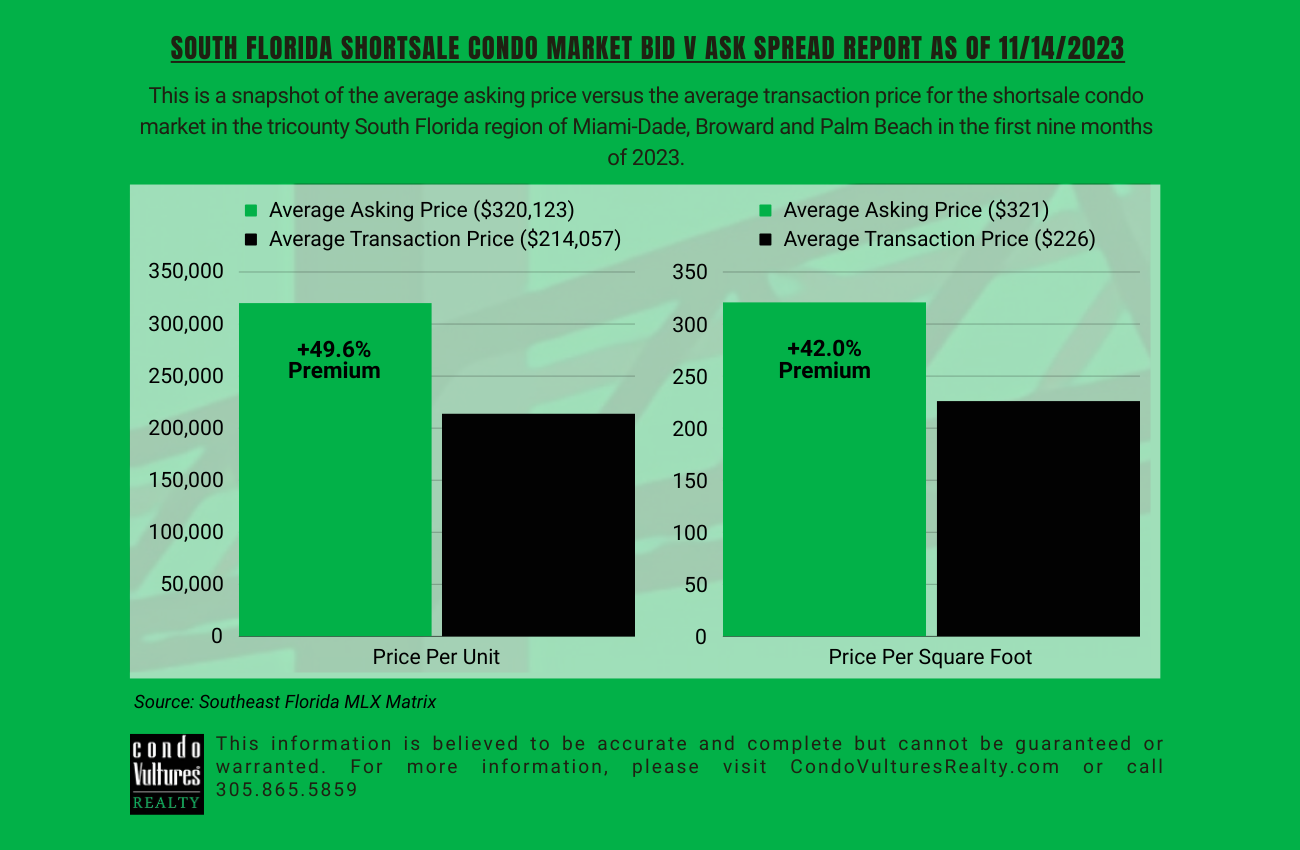
Currently, the average asking price for a condo is $320,123 per unit compared to an average sales price of $214,057 per unit. Pending sales went under contract at an average asking price of $190,847 per unit.
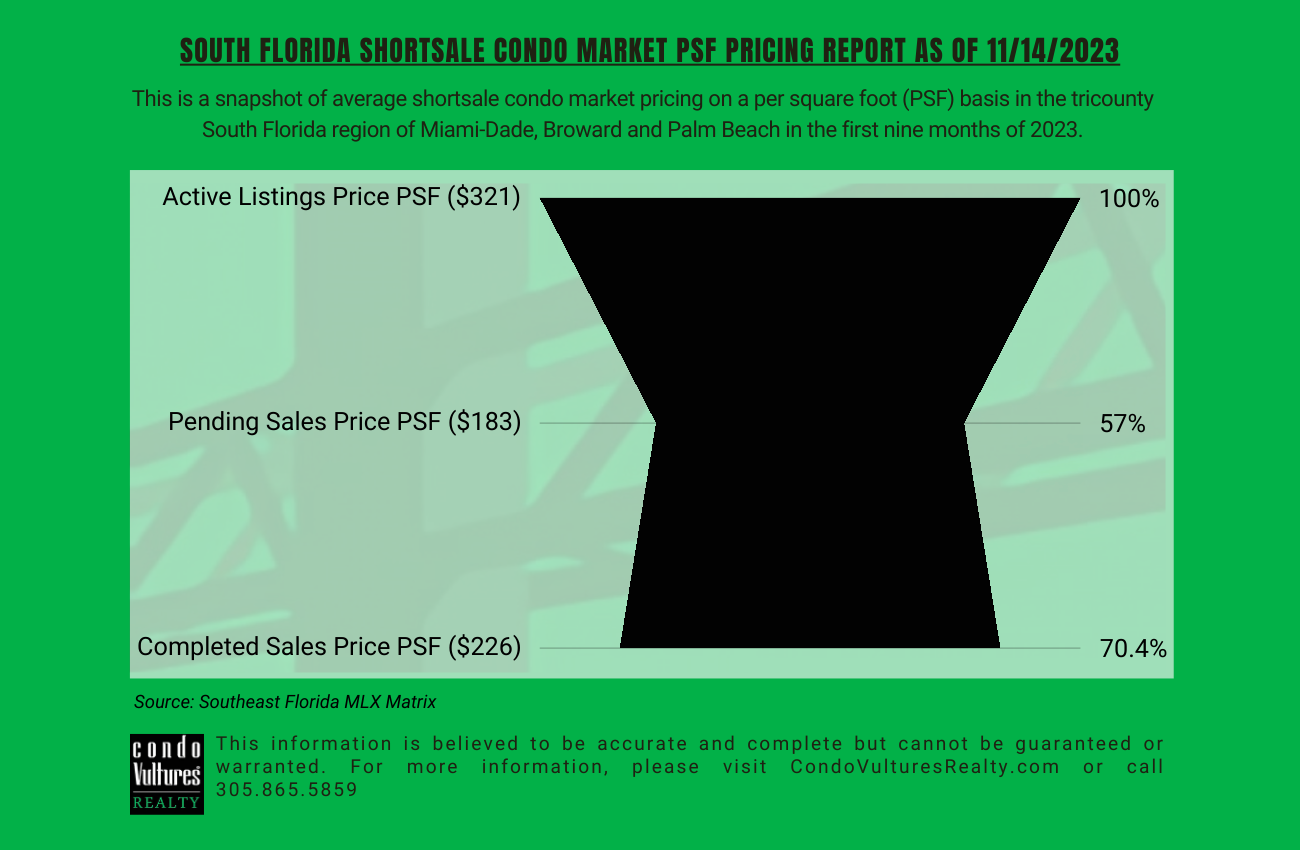
On a price per square foot basis, the average asking price for a condo is $321 psf compared to an average sales price of $226 psf. Pending sales went under contract at an average asking price of $183 psf.
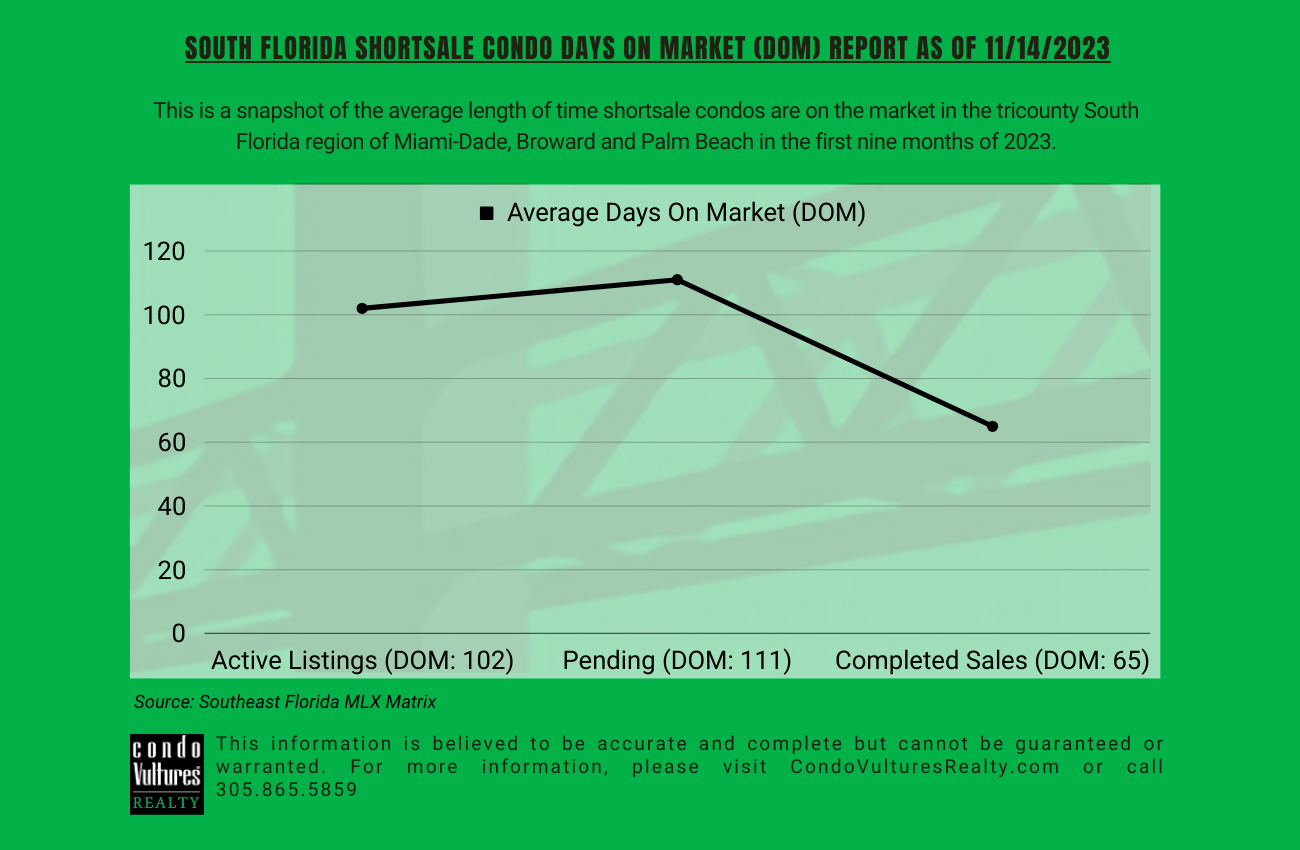
To gauge buyer sentiment, we focus on the Days On Market (DOM) category to better understand how purchasers are proceeding. If buyers are optimistic, the number of days an active listing is on the market should be similar or less than the average period of time for deals to date. If buyers are bearish, the DOM category will show active listing sitting on the market longer.
To gauge seller sentiment, we focus on the spread between the average asking price and the average transaction price on a per unit and per square foot basis. Generally, a spread of up to 20 percent suggests that a seller is willing to negotiate to complete a deal. Anything greater than 20 percent suggests that sellers are overly bullish on their prospects of selling their units at a premium.
This information is believed to be accurate and complete but cannot be guaranteed or warranted. For more information, please call 305.865.5859 or visit CondoVulturesRealty.com
For more information, please visit CondoVultures.com and sign up for our Substack newsletter
South Florida Shortsale Condo Market Velocity Report As Of 11/14/2023
|
| This is a snapshot of the shortsale condo market in the tricounty South Florida region of Miami-Dade, Broward and Palm Beach in the first nine months of 2023. |
| This information was compiled by CondoVulturesRealty.com. It is believed to be accurate and complete but cannot be guaranteed or warranted. For more information, please call 305.865.5859 |
|
Units |
Average Price Per Unit |
Average Price Per Square Foot |
Average Days On The Market |
| Current Active Shortsale Listings |
13 |
$320,123 |
$321 |
102 |
| Current Pending Sales |
15 |
$190,847 |
$183 |
111 |
| First Nine Months Of 2023 Completed Shortsale Transactions (January Through September) |
18 |
$214,057 |
$226 |
65 |
| Active Shortsale Listings v First Nine Months Of 2023 Completed Shortsale Spread |
|
49.6% |
42.0% |
56.9% |
| Average Monthly Shortsale Transactions Completed In The First Nine Months Of 2023 |
2.0 |
|
|
|
| Average Months Of Shortsale Supply Currently Actively Listed |
6.5 |
|
|
|
| Source: Southeast Florida MLX Matrix |
 Published by Peter Zalewski
 11/14/2023
  4:06:01 PM